CMBS Maturity Crisis Peaks in July: $2.54B Hard Maturities, 68% of Office in Special Servicing — Retail Malls Facing Refinancing Apocalypse as New York Office Rebounds
Min 1
The week of July 20th revealed commercial real estate maturity crisis cascading into crisis peak. Trepp's analysis of July 2026 CMBS hard maturities (loans with no remaining extension options) showed $2.54 billion of principal requiring immediate refinancing or restructuring.
The $2.54B hard maturity pool represents dangerous concentration: a small number of large loans (48.37% within just a handful of assets) dominating exposure, with most being regional malls and large office properties facing negative refinancing dynamics.
The refinancing challenge data proves stark: 36% of 2026 CMBS maturities carry debt yields of 8% or lower, making traditional refinancing nearly impossible.
When a $100 million property generates $7 million annual debt service (7% yield) but refinancing lenders require 9%+ yields to compensate for risk, the refinance economics fail. The borrower faces choice: (1) negotiate restructuring/modification (special servicing), (2) sell at distressed discount, or (3) default.
The special servicing data reveals market strategy shift toward workouts. Overall $2.54B hard maturity pool shows 24.99% already in special servicing ($636.37M).
But office subsector jumped to 68.42% in special servicing of office hard maturities, revealing lenders and borrowers negotiating solutions ahead of outright defaults. The shift from traditional default to negotiated modification suggests both lenders and borrowers preferring structured resolution over foreclosure.
Min 2
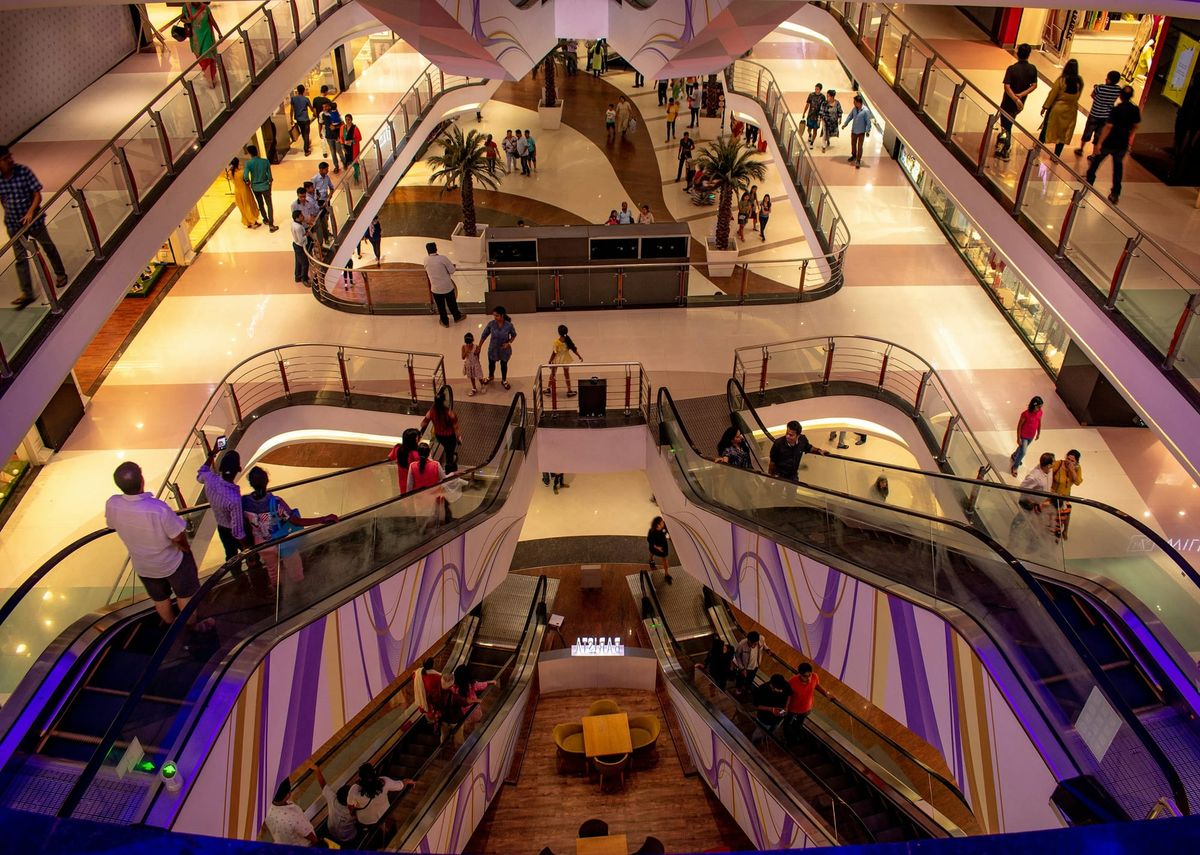
The retail crisis within CMBS maturity wave shows particular acuteness. Regional malls and super-regional malls comprise substantial portion of July hard maturities, facing dual headwinds: (1) post-pandemic traffic never recovered (office building nearby driving retail foot traffic no longer occurs), and (2) e-commerce continued shifting retail from physical to digital.
A regional mall generating $8 million annually in NOI (net operating income) in 2019 might be generating $4-5 million by 2026 as anchor tenant closures and vacancy accelerate.
The enclosed mall inventory data (from week's coverage) showed malls shrinking by roughly one-third over 24 years, with survivors "bookended by solid performers and weaklings that'll probably get redeveloped."
That phrase encapsulates the mall bifurcation: top-tier A-class regional malls with strong anchors and demographics surviving, while secondary/tertiary malls facing obsolescence. The CMBS maturity crisis concentrating heavily among secondary mall properties with insufficient cash flow to refinance.
The San Francisco office distress exemplifying sector-wide challenges: 25 Taylor Street (53,617 sf) changed hands resolving distressed $169.3 million CMBS loan.
The resolution (sale of property) rather than refinancing reveals lender recognizing property unable to support refinancing debt. The property sale resolving distressed CMBS while creating opportunity for new investor acquiring asset at restructured debt level.
Min 3
The New York office market bifurcation shows stark contrast to San Francisco distress. SL Green Realty reported leasing spreads at replacement leases of 18% during the quarter, indicating new lease rates 18% above expiring lease rates.
That rent growth demonstrates market strength—existing tenants renewing at materially higher rates. The New York office revival driven by financial services sector strength (banking, private equity, hedge funds) and AI-driven technology presence, with landlords raising rents and capturing meaningful spread improvements.
The Dallas-Fort Worth market shift shows nuanced recovery: lower-tier office properties playing bigger role in market improvement. The comment suggests C-class and secondary office properties benefiting from space-seeking companies relocating from expensive coastal markets (San Francisco, New York, Boston) to lower-cost alternatives.
The lower-tier property strength shows geography arbitrage working: companies escaping $50-60/sf coastal rents moving to $25-30/sf DFW market rates.
The national office stabilization narrative masks severe regional divergence. New York recovering with 18% rent growth spreads. San Francisco struggling with distressed asset sales. Denver, Phoenix, secondary metros struggling with excess supply.
The CMBS maturity crisis concentrating among weakest properties in weakest markets (secondary malls, secondary office in declining metros) while strongest properties in strongest markets (New York office, top-tier regional malls in resilient metros) refinancing successfully.
Min 4
The investor implications show bifurcated opportunity/risk. Investors with capital can acquire distressed CMBS loans at discounts or acquire underlying properties at depressed valuations.
A $100M office property in secondary market with $70M first mortgage in special servicing might be acquired for $50-60M if lender accelerates restructuring. That acquisition creates 30-40% immediate equity value if property eventually stabilizes and generates normalized NOI.
The refinance strategy divergence shows properties in strong markets (New York, top-tier malls) refinancing successfully, while secondary market properties requiring special servicing or sales.
Investors holding properties in secondary markets facing pressure to sell into declining value environment or restructure debt into modified terms. The portfolio composition now critical—overweight to secondary office/retail creates refinancing crisis risk.
The retail mall redevelopment strategy gains urgency as special servicing accelerates. An aging regional mall (100,000 sf) in secondary market might be redeveloped into mixed-use (apartments, medical office, entertainment) capturing value from adaptive reuse.
The redevelopment strategy requires significant capital but transforms obsolete retail into productive use. Investors with capital and redevelopment expertise acquiring distressed mall properties at 50-60% discounts could capture substantial value through conversion.
Min 5
The forecast implications show CMBS maturity crisis potentially worsening through 2026-2027 if refinancing conditions tighten further. With rates at 6.5%+ and debt yields at 8%+ required for lender appetite, properties generating less than 8% yield face refinancing impossible.
The 36% of 2026 maturities at 8% or lower debt yield suggests substantial refinancing challenge persisting indefinitely unless rates decline meaningfully.
The special servicing trajectory shows potential acceleration if more properties fall below refinancing thresholds. Current 24.99% overall in special servicing could climb toward 40-50% if refinancing conditions tighten or if property performance deteriorates.
The office subsector already at 68.42% special servicing likely approaching maximum with remaining office properties either successfully refinancing or accepting workout modifications.
The mall restructuring strategy shows wave of secondary mall closures/redevelopments likely accelerating through 2026-2027. The enclosed mall inventory already declined one-third; further decline appears structural not cyclical.
Investors acquiring mall properties at distressed valuations through 2026-2027 could position for 2027-2028 recovery if redevelopment strategies succeed. The timeline matters: distressed acquisition 2026, redevelopment 2026-2027, stabilized NOI 2027-2028.
Takeaway
Trepp analysis released week of July 20, 2026 showed July 2026 CMBS hard maturities totaling $2.54 billion with 36% carrying debt yields of 8% or lower making traditional refinancing nearly impossible and 24.99% already in special servicing.
Office subsector revealed particular acute distress: 68.42% of office hard maturities in special servicing indicating lenders and borrowers negotiating solutions ahead of defaults. Concentration extreme: 48.37% of $2.54B within handful of large loans, mostly regional malls and large office properties.
New York office market showing recovery with SL Green Realty reporting 18% leasing spreads on replacement leases, indicating new tenants paying 18% above expiring rates. San Francisco office distressed: 25 Taylor Street property changed hands resolving $169.3 million CMBS loan through sale rather than refinancing.
Dallas-Fort Worth showing nuanced recovery with lower-tier office properties leading improvement from space-seeking companies relocating from expensive coastal markets. National office stabilization narrative masks severe regional divergence with strongest markets (New York, top DFW locations) recovering while secondary markets (Denver, Phoenix, San Francisco secondary) struggling.
Retail mall crisis within CMBS maturity wave shows particular acuteness with regional/super-regional malls facing dual headwinds: post-pandemic traffic recovery absent and e-commerce continued retail erosion.
Enclosed mall inventory declined one-third over 24 years, with survivors "bookended by solid performers and weaklings that'll probably get redeveloped."
Special servicing concentration showing lender-borrower preference for negotiated workouts over foreclosures, indicating both parties recognizing traditional default counterproductive.
Investor implications show bifurcated opportunity and risk: properties in strong markets (New York office, top-tier malls) successfully refinancing while secondary market properties requiring special servicing or distressed sales. Portfolio composition critical with overweight secondary office/retail creating refinancing crisis risk.
Redevelopment strategy gains urgency for secondary mall properties: adaptive reuse from retail to mixed-use (apartments, medical office, entertainment) with investors acquiring distressed properties at 50-60% discounts capturing substantial value through conversion.
Forecast shows CMBS maturity crisis potentially worsening through 2026-2027 with 36% of 2026 maturities at 8% or lower debt yield facing refinancing challenges indefinitely unless rates decline meaningfully. Special servicing trajectory accelerating: current 24.99% overall could climb toward 40-50% if conditions tighten or property performance deteriorates.
Secondary mall closures/redevelopments likely accelerating through 2026-2027 as structural decline appears permanent. Investors acquiring distressed properties 2026 could position for recovery through 2027-2028 if redevelopment strategies execute successfully.